Shocking All Cause Mortality ONS | UK Vaccination Data
This is a colossal failure of public health agencies to protect the most vulnerable among us
A Twitter discussion tonight prompted a deeper dive into some of the world’s most granular COVID-19 vaccine datasets. Of course we are speaking of UK’s Office for National Statistics. ONS has presented fantastic data since the beginning of the pandemic unlike most other developed countries.
The chart below, lifted from Queen Mary University of London Professor Norman Fenton, was dismissed because of alleged misrepresentation of the data by Alex Berenson’s article (even though they are different charts).


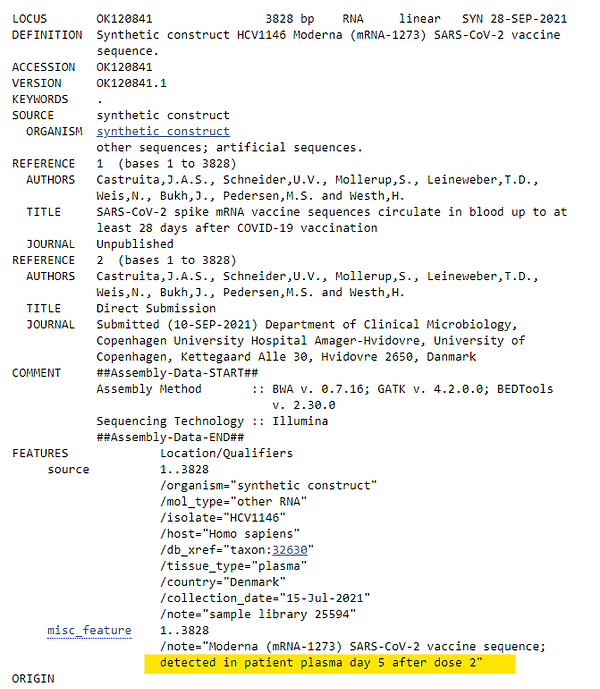
So I decided to do a deeper dive into the ONS data and evaluate excess mortality among the 90+ age demographic. If the vaccines are safe and effective, we would expect the data in arguably the most vulnerable cohort to demonstrate this. Understanding the cytotoxicity of biologically active S1 and the recent finding by Castruita et al that spike sequences can circulate in the blood up to at least 28 days post COVID-19 vaccination, I expected to find nothing good.


ONS separates all of the vaccination data into five vaccine status categories:
Unvaccinated
Within 21 days of first dose
21 days or more after first dose
Within 21 days of second dose
21 days or more after second dose
The unvaccinated in my chart are truly vaccine naïve, having never been pierced with any COVID jabs. We are not playing data obfuscation or revisionist history games here - rewriting what constitutes “unvaccinated”.
Revision
Since I published this, I have found a couple of articles disputing this dataset. So I'm including these links and withholding my conclusions for the moment.
New ONS report on deaths by vaccination: serious anomalies and further obfuscation
Website source page: https://www.ons.gov.uk/peoplepopulationandcommunity/birthsdeathsandmarriages/deaths/datasets/deathsbyvaccinationstatusengland
Excel source data:
Methodology:


